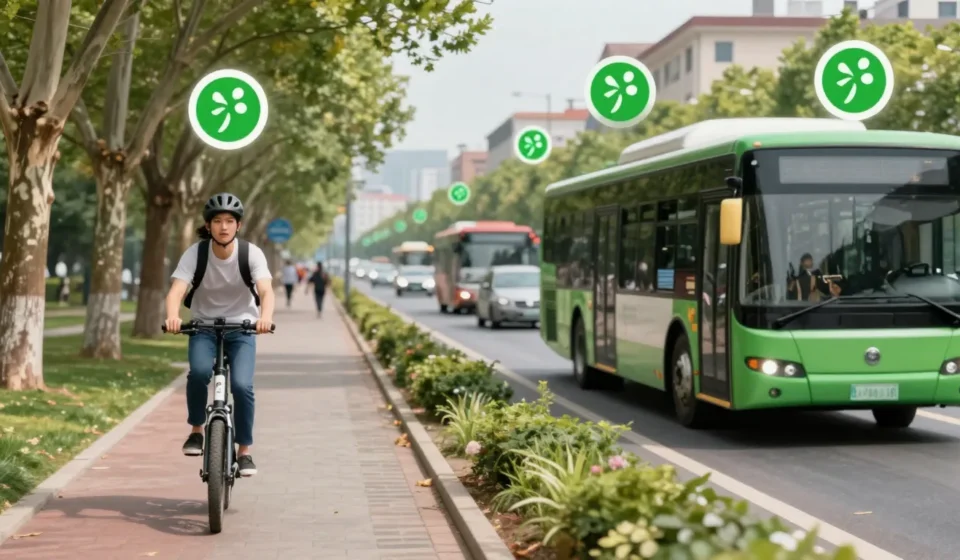
Electric Bike vs. Public Transit: Which Mode Really Shrinks Your Carbon Footprint?

The Real Carbon Cost of Getting Around
When weighing electric bike vs public transit for your daily commute, the carbon math isn’t as straightforward as you might think. While both are far greener than driving alone, their emission profiles depend on factors like energy sources, manufacturing, and usage patterns.
Let’s break down the numbers so you can choose the lowest-impact option for your lifestyle.
Electric Bike vs Public Transit: Lifecycle Emissions
An electric bike’s carbon footprint includes battery production, electricity for charging, and manufacturing. Studies show an e-bike emits about 22 grams of CO2 per kilometer over its lifetime, assuming a typical 10,000 km lifespan.
In contrast, a city bus with average ridership emits around 68 g CO2/km per passenger, while a metro train can be as low as 20 g CO2/km per passenger if powered by renewable energy.
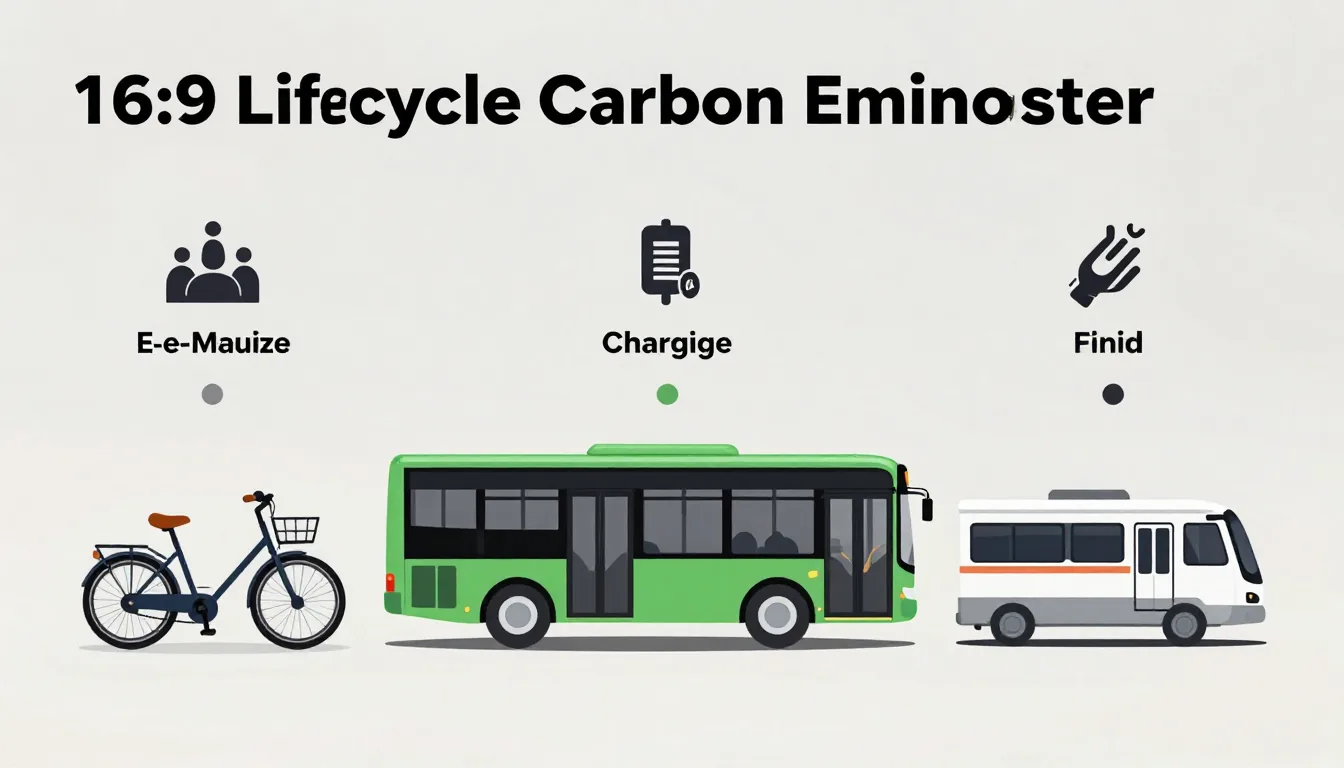
However, these averages hide key variations. For instance, if your city bus runs on diesel and is often empty, per-passenger emissions can soar above those of an e-bike.
Conversely, a fully packed electric train powered by renewables can outperform an e-bike. Understanding the electric bike vs public transit trade-offs is key to an informed decision.
Manufacturing Impacts and Battery Considerations
E-bike production, especially the lithium-ion battery, adds upfront emissions. But over its life, the e-bike's low operating energy means total emissions are still 5–10 times lower than a typical car.
Public transit vehicles have higher manufacturing emissions, but when spread over millions of passenger-km, they can be efficient.
Charging an e-bike on a grid with coal power increases its footprint, but even then it remains lower than a gasoline car. For transit, the energy mix matters hugely: electric buses in a hydro-powered region are near zero-emission.
The electric bike vs public transit decision thus depends heavily on local energy sources. Additionally, battery recycling programs are improving, further reducing e-bike lifecycle emissions over time.
When E-Bikes Win: Short to Medium Trips
For trips under 15 km, an e-bike typically has a lower carbon footprint than public transit. The e-bike's direct energy use per km is minimal, and you avoid the detours and stops of bus routes.
Plus, you save time and get light exercise.
If your commute involves hilly terrain or you need to carry cargo, an e-bike still beats transit in emissions unless the bus is fully electric and packed. For many, the electric bike vs public transit comparison favors the e-bike for short distances.
Consider that e-bikes also reduce congestion and require no waiting.
When Transit Wins: High-Density Urban Routes
In dense cities with frequent, clean-energy rail systems, public transit can be more efficient per passenger-km than e-bikes. For example, the London Underground emits about 14 g CO2/km per passenger.
A full bus in Bogotá's BRT system also achieves low per-capita emissions.
Transit becomes especially green when you combine it with walking or biking on either end. A bus or train ride plus a short walk often beats a door-to-door e-bike trip, especially if the e-bike's battery was charged on a dirty grid.
In such contexts, the electric bike vs public transit calculus flips toward transit.
Practical Guidance for Your Commute
To minimize your carbon footprint, consider these factors: distance, local transit energy mix, and your typical route. In many suburbs and smaller cities, an e-bike is the clear winner.
In denser urban centers with frequent electric trains, transit often edges ahead.
You can also combine both: ride an e-bike to a transit hub and take the train the rest of the way. This multimodal approach maximizes efficiency and flexibility.
For longer commutes, transit may be more practical, but an e-bike still offers lower emissions if you avoid peak hours.
Ultimately, the electric bike vs public transit decision hinges on your specific context. Both are powerful tools for reducing personal emissions—choose the one that integrates best into your life, and you’ll be driving (or pedaling) toward a cleaner future.
For more sustainable transportation insights, explore our Sustainability & Ecology category. And check out European Environment Agency data on transport emissions or ITF research on passenger mobility carbon footprints for deeper analysis.